At a glance
Artificial-intelligence-linked shares are again at the centre of the global market story. On 23 September, the Nasdaq Composite reached an all-time high, while the broader S&P 500 was little changed, illustrating both the strength of technology leadership and its uneven reach across the market. Asian trading also reflected that mood, with early gains in Japan and South Korea reported after the US session. [6] For readers in India and elsewhere, the relevance is not confined to US exchanges: global equity funds, technology supply chains, currencies and corporate investment plans all respond to the same shift in expectations.
The essential question is not whether AI is economically important. It is whether the large profits and productivity gains now embedded in share prices can arrive on the timetable investors expect. Recent analysis by the European Central Bank says strong realised and expected earnings linked to AI have supported US valuations, alongside low risk compensation. That combination can sustain high prices, but it also means new results are judged against a more exacting benchmark. [1]
Why earnings remain the rally’s foundation
There is concrete business activity behind the enthusiasm. NVIDIA reported second-quarter fiscal 2027 revenue of $96.2 billion, up 106% from a year earlier, and data-centre revenue of $89.0 billion, up 117%. Its third-quarter revenue outlook was $108 billion, plus or minus 2%, and it said the outlook assumed no data-centre compute revenue from China. [2] Those figures are one indicator of the demand being created as cloud providers, model developers and enterprises build and operate AI systems.
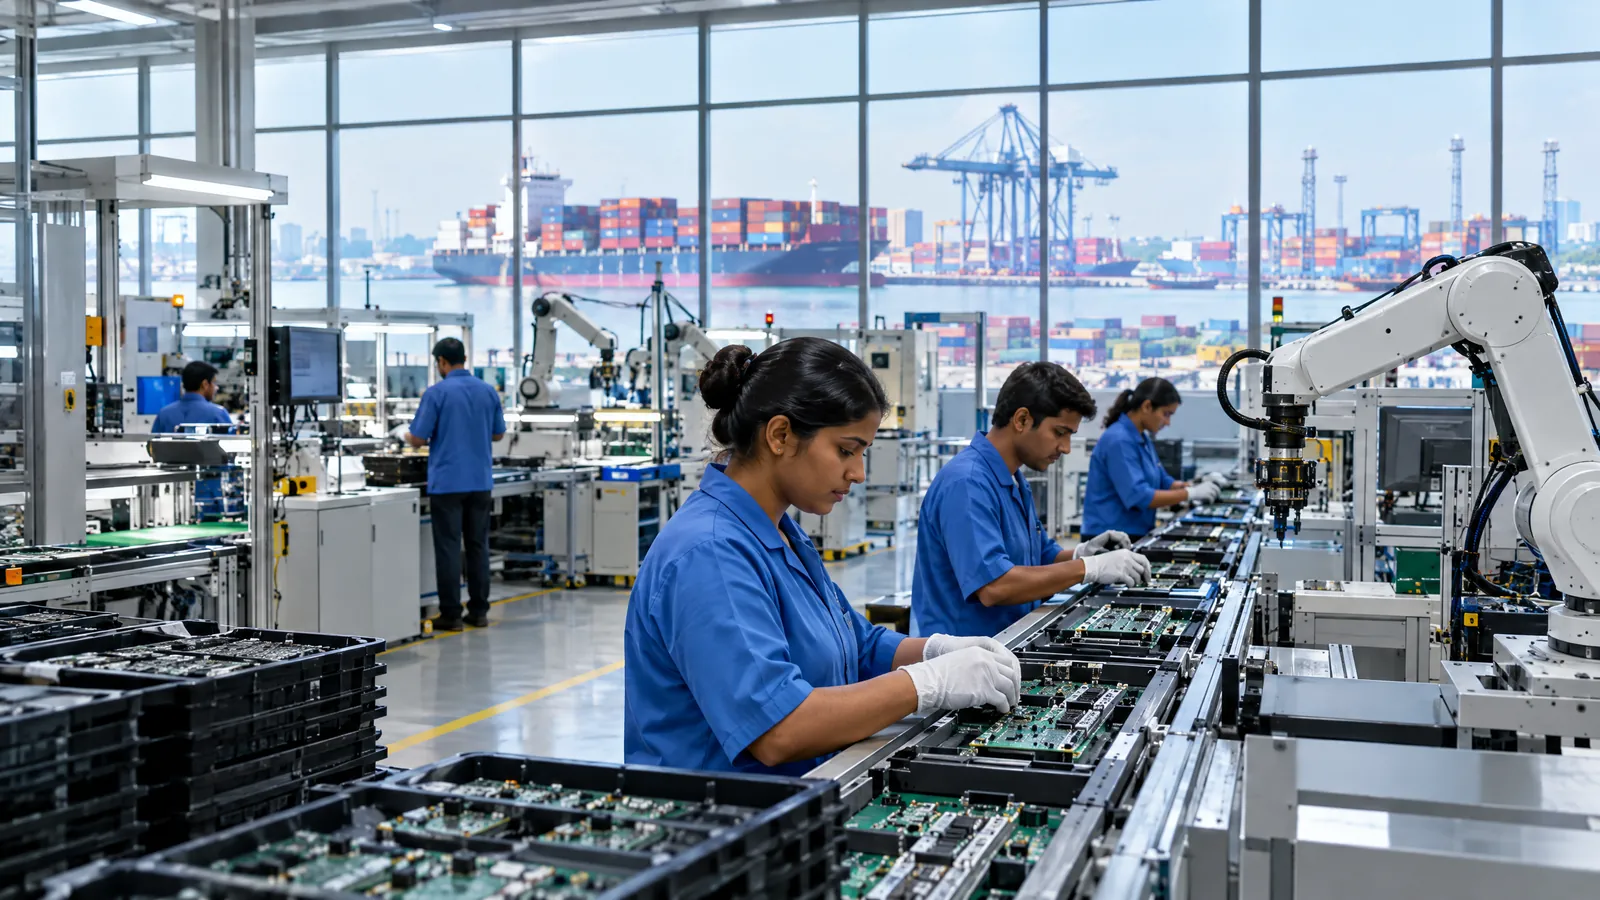
That demand reaches well beyond chip designers. It can support makers of memory, networking equipment, servers, power systems and data-centre services, as well as software companies that can demonstrate useful applications. Reuters reported that NVIDIA’s August forecast strengthened technology shares and eased near-term worries about demand, while investors also responded to raised forecasts at software and cybersecurity companies. [5] The market is therefore looking for evidence that investment is producing revenue in several layers of the industry, rather than simply moving spending from one company to another.
Earnings expectations nevertheless describe the future, not just the quarter that has closed. Equity prices incorporate assumptions about sales growth, margins, competition and how long a period of exceptional demand can last. The ECB’s dividend-discount analysis identifies expectations of continuing corporate profitability as the main force supporting US risk-asset prices during the AI boom. [1] When expectations are high, even a result that shows growth can prompt a repricing if it falls short of the growth already assumed.
Infrastructure spending creates both momentum and a test
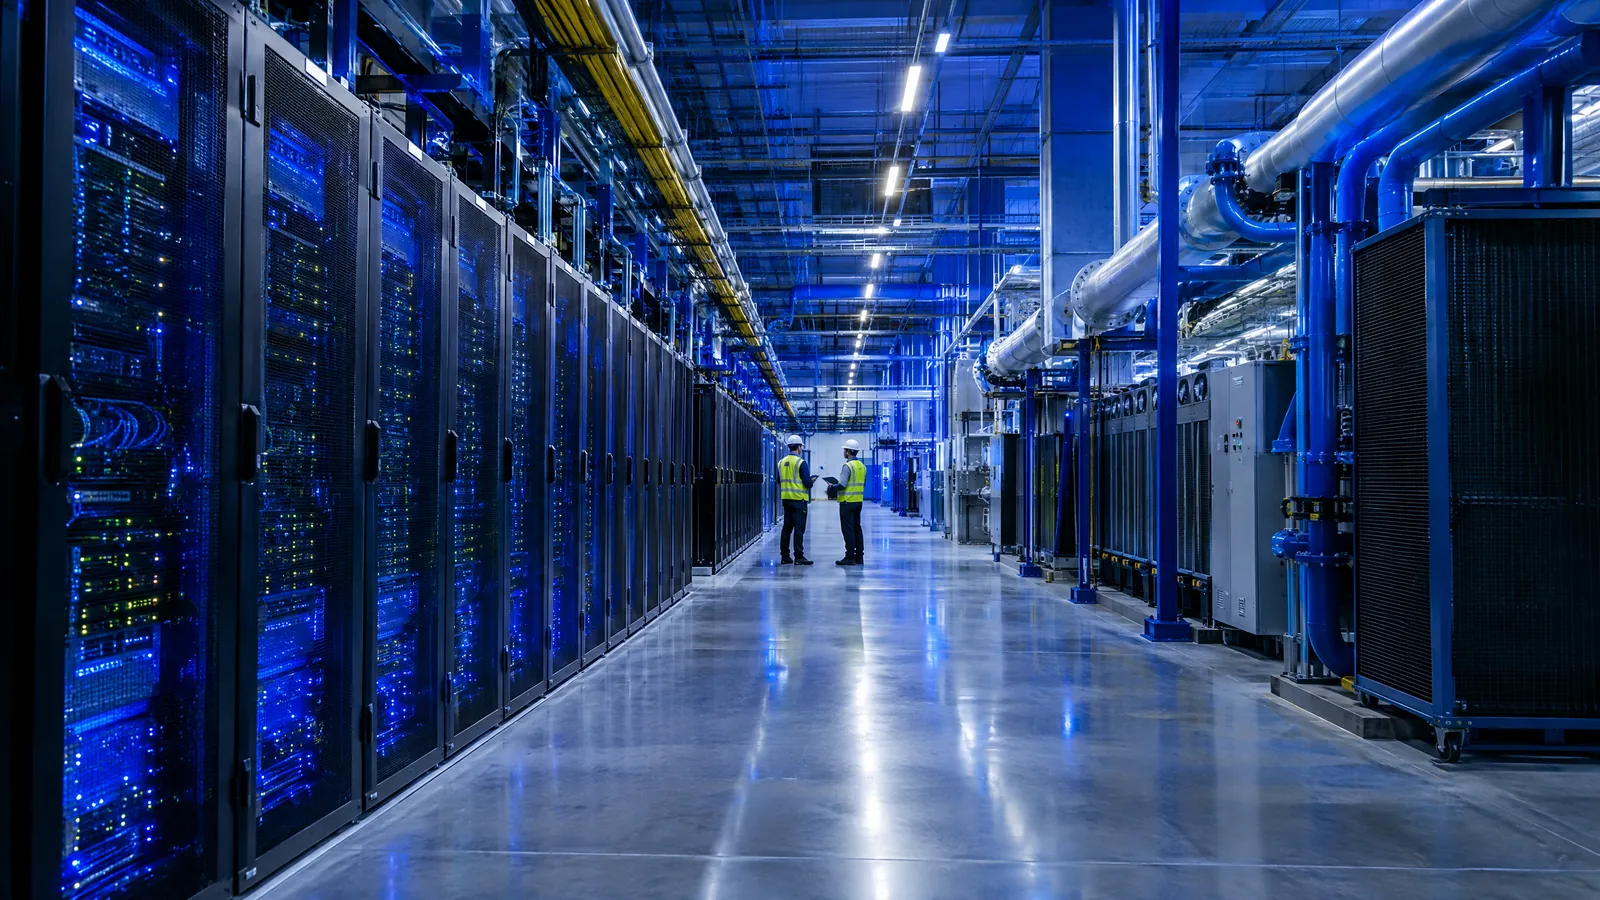
The AI build-out requires costly physical infrastructure: specialised chips, memory, networking, data-centre capacity, electricity and cooling. This helps explain the current earnings strength in parts of the supply chain. It also creates a practical test for the companies funding the expansion. They will need to show that AI services, advertising tools, cloud products or other applications generate sufficient income over time to justify the cost of the equipment and facilities.
The timing is uncertain. Capacity can be commissioned before customer demand matures, while faster chips and changing model designs can alter the useful life of earlier equipment. Supply constraints matter too: Reuters noted NVIDIA’s warning that shortages of memory components could curb the pace of industry growth. [5] Higher energy costs, financing costs and supply-chain disruptions can change project economics even when the long-term technology case remains intact.
This distinction matters for interpreting headlines about capital expenditure. A large announced programme can signal confidence in demand, but it is not, by itself, proof of eventual returns. Conversely, a slower pace of spending can reflect capacity discipline or a changing deployment schedule rather than a single conclusion about AI adoption. The useful evidence comes from the interaction of bookings, utilisation, pricing, margins, cash generation and the customer use cases companies describe over successive reporting periods.
Concentration turns company results into market events
The rally’s other defining feature is concentration. In a market-capitalisation-weighted index, the largest companies exert the largest influence on the index. If a small group of mega-cap technology businesses rises together, an index can look resilient even when many constituent shares lag. The reverse is also true: disappointing results or a changed view of future returns at a few large firms can have an outsized effect on benchmark performance and on funds designed to track it.
The ECB says its concentration measure for the broader S&P 500 was above its historical 95th percentile in late August, and warns that underperformance by a few mega-cap companies tied to substantial AI investment could spill into the wider market. [1] That is a structural point, rather than a prediction of an immediate reversal. It means that a headline index offers less information about the breadth of participation than it might in a less concentrated market.
The exposure travels across borders. The ECB has separately highlighted euro-area holdings of US technology equities through mutual funds and exchange-traded funds, and says a US correction would not necessarily remain a US issue. [7] Similar channels are relevant to globally diversified portfolios available to Indian savers and institutions. Currency movements, foreign portfolio flows and changes in risk sentiment can add another layer to how overseas technology volatility is felt locally.
What happens next
The next phase will be measured against evidence, not only excitement. Markets will parse earnings and guidance from chip suppliers, cloud providers and software groups for signs that demand remains broad and that the cost of AI infrastructure is translating into durable revenue. They will also watch whether leadership extends beyond a handful of large firms, because broader participation would change the concentration picture even if index levels do not move much.
The macroeconomic backdrop remains important. The Federal Reserve said in May that broad equity valuations were elevated and that its estimate of the equity premium was well below its historical average; respondents to its stability survey also cited AI among notable risks. [3] The IMF has likewise flagged stretched valuations and concentration, particularly in AI-related firms, as downside risks in equity markets. [4] Inflation, interest rates, energy prices and geopolitical developments can affect both the discount rate applied to future profits and the cost of building capacity.
For a broad audience, the central lesson is one of uncertainty rather than a directional call. AI may produce significant commercial and productivity gains, but the pace, distribution and durability of those gains are not yet settled. Upcoming company reports, capital-spending updates and market breadth will help show whether earnings are catching up with expectations—or whether expectations need to adjust.
Questions readers ask
Why can a small number of technology companies move a broad index so much?
Many widely followed indices give companies a weight based on their market value. When the largest companies account for a substantial share of an index, changes in their share prices have a larger effect on the index than changes in smaller constituents.
What does an equity risk premium indicate?
It is a way of describing the extra return investors expect for holding shares instead of a lower-risk asset. A lower implied premium can indicate that investors are accepting less compensation for equity risk, although methods of estimating it differ.
Why are AI infrastructure costs relevant to earnings?
Data centres, chips, networking equipment, power and cooling require substantial expenditure. The eventual financial outcome depends on whether the services built on that infrastructure generate enough revenue and cash flow over time to cover those costs.
Sources
- US equity market developments during the AI boom — European Central Bank. Accessed 2026-09-23.
- NVIDIA Announces Financial Results for Second Quarter Fiscal 2027 — NVIDIA. Accessed 2026-09-23.
- Financial Stability Report, May 2026 — Board of Governors of the Federal Reserve System. Accessed 2026-09-23.
- Global Financial Stability Report, April 2026 — International Monetary Fund. Accessed 2026-09-23.
- Nasdaq, S&P 500 lifted by Nvidia's forecast; investors eye speech by Fed's Warsh — Reuters. Accessed 2026-09-23.
- Wall Street’s Nasdaq hits all-time high as AI frenzy gathers pace — Al Jazeera. Accessed 2026-09-23.
- The AI boom: rational enthusiasm or the next dot-com bubble? — European Central Bank. Accessed 2026-09-23.
By Anna News Desk. External reporting and official sources were reviewed. This explanatory article is for general information and does not provide personalised financial advice or a recommendation on any security.