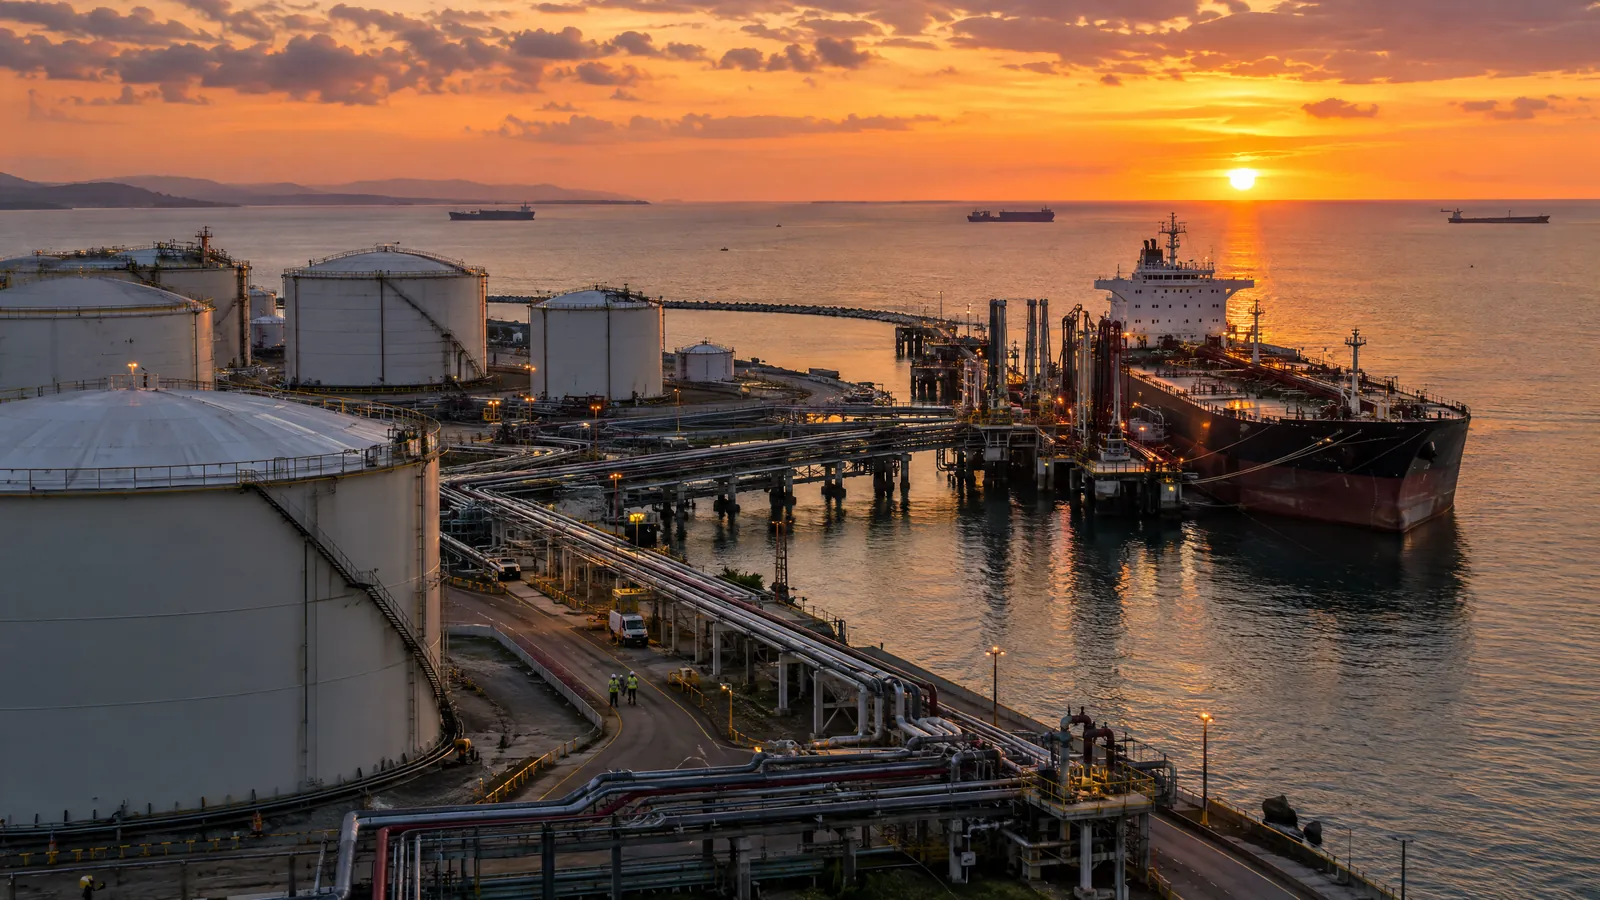
At a glance: oil’s outlook turns on physical flows, not one forecast
Crude oil enters late September with the market trying to reconcile two forces. Conflict-related disruption has removed or delayed supplies and pulled down inventories, while higher fuel costs are weakening consumption. The International Energy Agency’s September assessment projects world oil supply will average 100.7 million barrels a day in 2026, down 5.7 million barrels a day from 2025, and expects global demand to fall by 2.5 million barrels a day. It says the assumed return of normal Gulf flows has been pushed into 2027. [1]
That setting makes a price outlook conditional rather than linear. On 23 September, Reuters reported Brent futures at $98.47 a barrel at 0651 GMT, after six consecutive daily declines, as signs of improved Gulf supply and hopes of US-Iran talks changed the immediate mood. The same move illustrates the central uncertainty: prices can soften when a route reopens or talks appear constructive, even before the underlying supply system is fully restored. [5]
Supply decisions matter, but access to barrels matters more
Producer policy remains important because OPEC and its partners in the Declaration of Cooperation can influence planned output. Yet headline targets are only one part of the calculation in a disrupted market. The relevant question is how many barrels can be produced, loaded, insured, shipped and refined. OPEC’s September report expects liquids output from countries outside the cooperation framework to rise by about 0.6 million barrels a day in 2026, led by Brazil, the United States, Canada and Argentina. That prospective growth offers a partial offset, but it cannot automatically replace barrels that are unavailable at a particular port or quality. [4]
The restoration of alternative export paths is therefore a material supply decision in practice. Reuters reported that Saudi Arabia restarted the East-West Pipeline to the Red Sea on 22 September and had been using it to redirect about 4 million barrels a day around the Strait of Hormuz. Iraq also said it was increasing exports. These developments improve the route outlook, but they do not by themselves settle the scale, timing or security of future shipments. For refiners, the usable supply picture includes the grade of crude, voyage length and the availability of tankers as well as the headline volume. [5]
Demand forecasts diverge because their assumptions diverge
The major forecast gap is striking. The IEA expects high fuel prices, lower availability of middle distillates such as diesel and lost petrochemical feedstock to reduce 2026 oil demand by 2.5 million barrels a day. OPEC’s September Monthly Oil Market Report, by contrast, expects global demand to grow by about 0.4 million barrels a day in 2026, to 105.84 million barrels a day. For 2027, both organisations anticipate a rebound, although their levels and assumptions differ. [1] [3]
This is not a reason to treat one number as a final answer. Forecasts embed views about economic activity, transport, industrial use, prices and the duration of supply disruption. The IEA’s outlook explicitly assumes constraints on Middle East exports persist through year-end and that production stays below pre-conflict averages until the second quarter of 2027. The US Energy Information Administration, meanwhile, expects gradually increasing Hormuz flows and alternative routes, forecasting Brent at about $90 a barrel in the second half of 2026 and an average of $74 in 2027 as output rises and inventories rebuild. [2]
Stocks, refinery capacity and freight turn disruption into prices
Oil is not a single, frictionless market. Crude must reach a refinery, and refined products must reach users. The IEA said observed global oil inventories had fallen by 507 million barrels since February, including a 95 million-barrel fall in August. It also reported that tanker traffic from the Middle East had faced renewed attacks and that refinery runs were reduced in several regions. Lower stocks can cushion an interruption for a time, but they leave less room for a further shock and make market reactions more sensitive to fresh information. [1]
The refined-product side can also behave differently from the crude benchmark. The IEA identified diesel and gasoil as particularly tight, while OPEC described August refining margins as mixed across the US Gulf Coast, Rotterdam and Singapore. This helps explain why a movement in Brent should not be read as a complete measure of fuel conditions. Freight rates, refinery outages, product inventories and regional specifications can widen or narrow the gap between a crude price and the cost faced by transport, industry or households. [1] [3]
India’s exposure is shaped by imports, routes and the rupee
India has a direct interest in these moving parts because it remains heavily dependent on imported crude. The Ministry of Statistics and Programme Implementation put crude-oil import dependence at 89.44% in FY 2024-25, using a supply-side measure. In a March briefing on regional disruption, the government said India sourced crude from around 40 countries and that about 70% of imports were then arriving on routes outside the Strait of Hormuz. That diversification can reduce concentration risk, but it does not remove exposure to global benchmarks and shipping costs. [6] [7]
For Indian consumers and businesses, the effect is not a one-for-one translation from a Brent headline into local fuel prices. The landed cost of crude also reflects the grade bought, freight, insurance, exchange rates and refining economics; taxes and policy choices influence retail outcomes. Refineries can also change the crude mix they process, although a substitute grade may carry a different yield of diesel, petrol or other products. The practical indicators to follow are the continuity of cargoes, freight and insurance conditions, refinery operations and the rupee alongside benchmark crude. Those factors provide more context than a single intraday price move.
What happens next: watch route reliability, inventories and diplomacy
The next phase will be tested against observable evidence. Weekly and monthly inventory data will show whether the draw is slowing. Export loadings and tanker movements will indicate whether alternative Gulf routes are operating reliably. Refinery runs and diesel availability will reveal whether the product shortage is easing. Finally, diplomatic progress could alter the timetable for restoring flows, while renewed disruption could have the opposite effect. The range between the IEA’s contraction forecast and OPEC’s modest-growth view is a reminder that the crude-oil outlook remains unusually dependent on events that cannot be forecast with precision. [1] [3]
Questions readers ask
Why can crude prices fall even when supply remains disrupted?
Prices reflect expectations as well as current conditions. Evidence that an export route is reopening, inventories are rebuilding or diplomacy may reduce disruption can lower the expected supply shortfall, even if physical conditions are still constrained.
Why do the IEA and OPEC have different 2026 demand forecasts?
They use different assumptions about economic activity, fuel prices, product availability and the duration of disruption. The IEA expects a 2026 decline, while OPEC expects modest growth, so the difference is a useful measure of uncertainty rather than a simple error to be averaged away.
Which oil indicators are most useful for understanding the outlook?
Watch reliable export and tanker-flow data, inventory changes, refinery operating rates, diesel availability, freight conditions and updates from the IEA, OPEC and official energy agencies. These show whether supply recovery is reaching end users.
Sources
- Oil Market Report – September 2026 — International Energy Agency. Accessed 2026-09-23.
- Short-Term Energy Outlook, September 2026 — U.S. Energy Information Administration. Accessed 2026-09-23.
- World oil demand, Monthly Oil Market Report – September 2026 — Organization of the Petroleum Exporting Countries. Accessed 2026-09-23.
- World oil supply, Monthly Oil Market Report – September 2026 — Organization of the Petroleum Exporting Countries. Accessed 2026-09-23.
- Oil falls on better supply outlook, hopes for US-Iran talks — Reuters. Accessed 2026-09-23.
- Energy Statistics India 2026 — Ministry of Statistics and Programme Implementation, Government of India. Accessed 2026-09-23.
- Inter-Ministerial Briefing held on Recent Developments in West Asia — Press Information Bureau, Government of India. Accessed 2026-09-23.
- Google Trends: crude oil, worldwide, past 30 days — Google Trends. Accessed 2026-09-23.
Anna News Desk reviewed external reporting and official sources listed below. This neutral explainer is for general information and does not constitute investment, trading or financial advice.