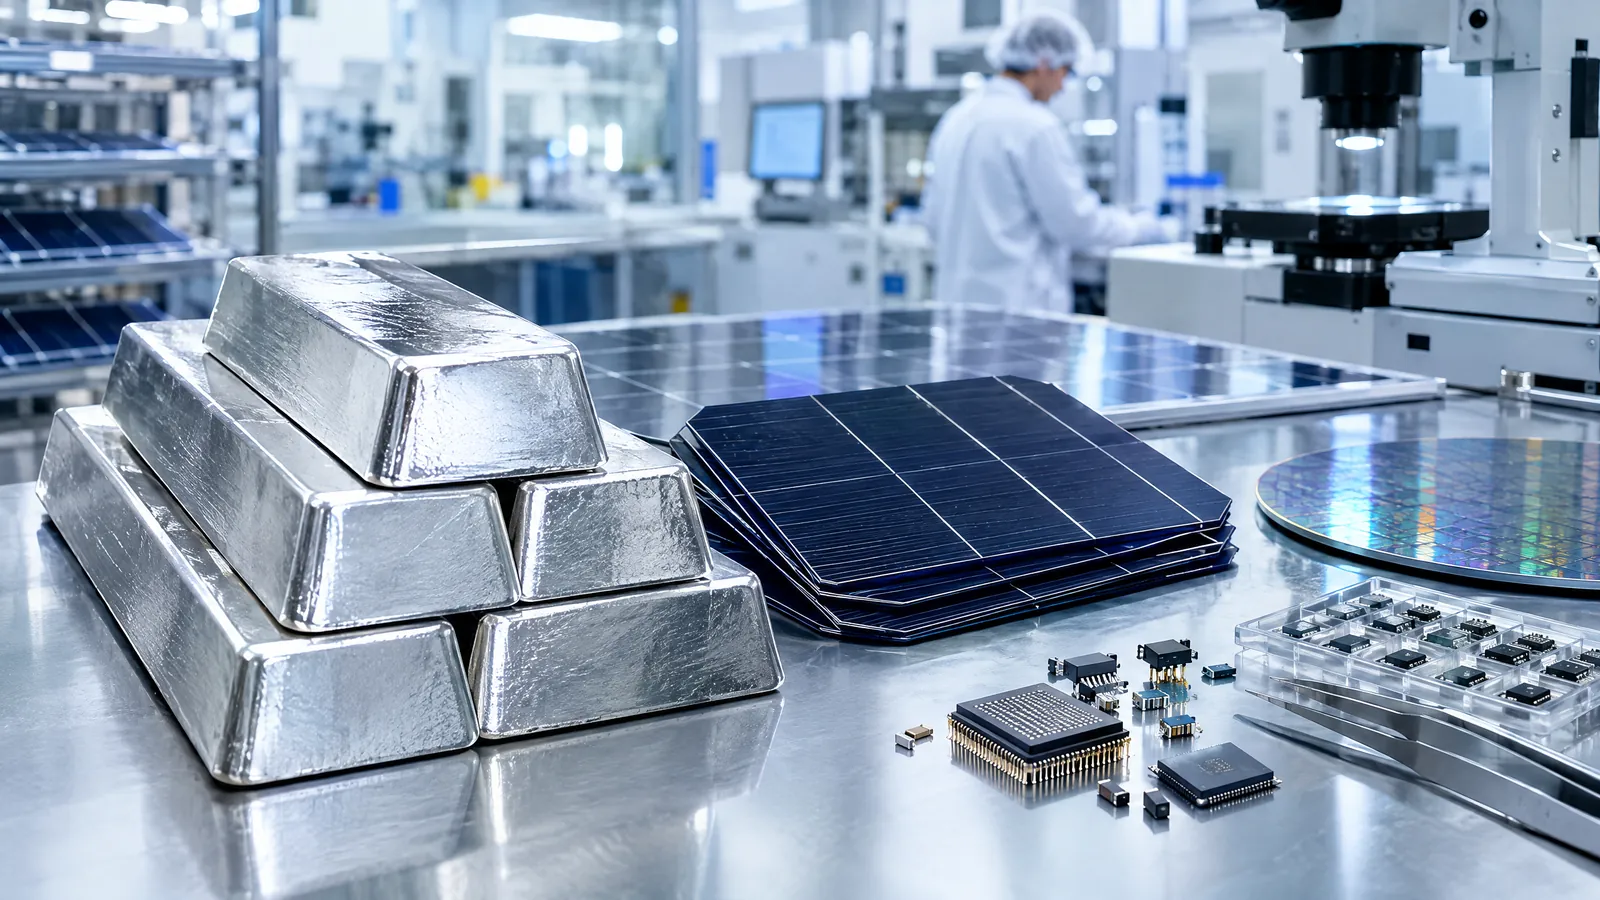
At a glance: a two-sided market
Silver sits at an unusual junction of the commodities market. It is used in solar cells, electronics, electrical contacts and industrial processes, but it is also held in bars, coins and exchange-traded products. Its price can therefore respond to manufacturing activity and technology deployment as well as currency conditions, interest-rate expectations and financial positioning.
The latest broad market estimates point to a smaller industrial total in 2025 and a further decline projected for 2026, even though global solar installations continued to rise. At the same time, the Silver Institute’s April outlook, prepared by Metals Focus, projected another market deficit because supply was also expected to ease and coin-and-bar demand was expected to strengthen. A deficit is an accounting measure of annual supply against demand; it does not by itself determine a price on a particular day. [1] [4]
For readers in India and elsewhere, silver is affected by several clocks at once. Factory orders and solar installations unfold over months or years; mine projects take longer; fund flows and vault movements can move much faster.
Solar growth does not translate directly into silver use
Photovoltaic manufacturing is a central part of the silver discussion because silver’s conductivity makes it useful in the contacts that collect electricity in many solar cells. The demand signal from deployment remains substantial: IEA PVPS estimates that 698 gigawatts of photovoltaic capacity were installed globally in 2025, up 16% from the prior year, with China accounting for about 60% of additions. India, the European Union and the United States were the next largest markets outside China. [3]
Yet more installed capacity does not guarantee that total silver use rises at the same rate. The World Silver Survey estimates photovoltaic silver demand fell 6% in 2025 to 186.6 million ounces and, in its April 2026 forecast, could fall to 151.0 million ounces in 2026. The forecast reflects thrifting, meaning manufacturers use less silver per cell, as well as changes in production and end-market conditions. This is why solar deployment and solar-related silver consumption should be tracked separately. [1] [4]
That distinction creates uncertainty in both directions. Rapid installation can support demand for solar components, while technical substitution, thinner metallisation and new cell designs can reduce material intensity. Module oversupply, trade rules and grid constraints can also affect the pace and geography of installations.
Electronics and electrification widen the industrial base
Solar is highly visible, but it is not the only industrial channel. Electrical and electronics applications represented 449.5 million ounces of silver demand in 2025 in the World Silver Survey’s estimates, compared with 186.6 million ounces for photovoltaics within that broader category. Silver is used where reliable conductivity, soldering, switching or reflective properties are needed. The mix includes consumer devices, data and communications equipment, vehicles, charging equipment and power networks. [1]
The direction of these uses is not uniform. The same survey attributed the 2025 decline in industrial offtake partly to lower photovoltaic demand and thrifting, while noting gains linked to artificial-intelligence-related data centres, high-speed transmission hardware, electric-vehicle penetration and charging infrastructure. This helps explain why a headline change in total industrial demand can conceal divergent trends beneath it. [1]
Electronics diversify demand beyond solar but also link silver to the business cycle. Slower manufacturing, weaker device sales or delayed infrastructure can weigh on fabrication, while investment in grids, data capacity and electrification can support it. These trends should be assessed against realised production, not announced capacity alone.
Mine supply moves slowly; recycling responds more quickly
Supply is another reason silver does not behave like a commodity produced mainly by dedicated mines. The US Geological Survey says silver is primarily obtained as a by-product from lead-zinc, copper and gold mines, in that order. Polymetallic deposits account for more than two-thirds of global and US silver resources. As a result, a decision to expand output can depend as much on the economics and schedules of the main metal as on the silver price. [2]
Global mine production rose modestly to an estimated 26,000 metric tonnes in 2025, according to the USGS. The Silver Institute put mine production at 846.6 million ounces that year and projected a slight decline to 844.1 million ounces in 2026. Such estimates can change as mines report results, but the narrow projected movement illustrates the limited immediate flexibility of primary supply. [1] [2]
Recycling is the more responsive part of the balance. The survey estimated recycled supply at 197.6 million ounces in 2025 and forecast 211.3 million ounces for 2026. Higher prices can encourage returns of jewellery, silverware and industrial scrap, although collection and refining capacity can constrain flows. [1]
Investment flows can amplify a tight physical market
Investment demand can affect the silver market through coins and bars as well as physically backed exchange-traded products, often called ETPs. These channels do not simply express an opinion about price: when a fund adds metal, its custody and vault location can affect the amount of readily available silver in a trading hub. This mattered in 2025, when the World Silver Survey reported combined ETP holdings rising 26%, or 273 million ounces, to a record 1.3 billion ounces at year-end. [1]
The survey reported a 35.8-million-ounce ETP reversal through end-February 2026 as some North American and European holders took profits, partly offset by Asian inflows. Reuters reported in April that London conditions had improved, while renewed ETP inflows could tighten liquidity again. [1] [4]
This is why price moves can exceed the effect of annual industrial demand alone. Available stocks, their location and custody flows can influence short-term liquidity. Google Trends was reviewed on 23 September, but query-level India data for ‘silver price’ was not verifiable here; no search-volume estimate or claim of a current surge is made. [5]
What happens next: signals worth following
The next phase will be shaped by measured evidence rather than any single narrative. Watch solar installation data alongside manufacturers’ reported silver intensity, electronics and vehicle production, mine guidance from copper, lead-zinc and gold operators, and recycling volumes. Each tracks a different part of the balance.
ETP holdings, coin-and-bar demand and vault stocks can help explain physical-market tightness, but may reverse quickly and are not equivalent to long-term industrial consumption. Exchange rates, real interest-rate expectations and global growth remain additional uncertainties.
Solar remains a significant structural use case, electronics broaden demand, and by-product mining limits a rapid supply response. Thrifting, cyclical manufacturing conditions, recycling and variable investment flows can pull the other way. No price path is assured.
Questions readers ask
Why can solar installations rise while silver demand from solar falls?
Solar-cell makers can reduce the amount of silver used per cell through thrifting and changes in manufacturing technology. Total photovoltaic silver demand depends on both the number of panels produced and silver intensity per panel.
Why does by-product mining matter for silver supply?
Much of the world’s silver is produced from mines focused on copper, lead-zinc or gold. Output decisions therefore reflect the economics, grades and schedules of those main metals, which can make silver supply slower to respond to a price change.
What does a silver market deficit mean?
It means estimated annual demand exceeds estimated annual supply in a market-balance calculation. Existing above-ground stocks, recycling, inventory movements and investment flows still influence availability and prices, so a deficit does not guarantee a particular price outcome.
Sources
- World Silver Survey 2026 — The Silver Institute / Metals Focus. Accessed 2026-09-23.
- Mineral Commodity Summaries 2026: Silver — U.S. Geological Survey. Accessed 2026-09-23.
- A Snapshot of Global PV Markets 2026 — IEA Photovoltaic Power Systems Programme. Accessed 2026-09-23.
- Silver faces sixth year of deficit with stock drawdown raising squeeze risks, research shows — Reuters. Accessed 2026-09-23.
- Google Trends — Google. Accessed 2026-09-23.
This is neutral explanatory journalism, not personal investment advice or a price forecast. Anna News Desk reviewed external reporting and official, institutional and industry sources listed above; market estimates and forecasts may change as new data is released.